
如需转载,请根据 知识共享署名-非商业性使用-相同方式共享 4.0 国际许可协议 许可,附上本文作者及链接。
本文作者: 执笔成念
作者昵称: zbcn
本文链接: https://1363653611.github.io/zbcn.github.io/2021/01/05/springcloud-05Hystrix-dashboard%E7%9F%AD%E8%B7%AF%E5%99%A8%E6%89%A7%E8%A1%8C%E7%9B%91%E6%8E%A7/
Hystrix Dashboard 短路器执行监控
Hystrix Dashboard 是Spring Cloud中查看Hystrix实例执行情况的一种仪表盘组件,支持查看单个实例和查看集群实例。
简介
Hystrix提供了Hystrix Dashboard来实时监控HystrixCommand方法的执行情况。 Hystrix Dashboard可以有效地反映出每个Hystrix实例的运行情况,帮助我们快速发现系统中的问题,从而采取对应措施。
Hystrix 单个实例监控
我们先通过使用Hystrix Dashboard监控单个Hystrix实例来了解下它的使用方法。
创建一个hystrix-dashboard模块
用来监控hystrix实例的执行情况。
- 引入 pom依赖
1 | <dependency> |
2 | <groupId>org.springframework.cloud</groupId> |
3 | <artifactId>spring-cloud-starter-netflix-eureka-client</artifactId> |
4 | </dependency> |
5 | <dependency> |
6 | <groupId>org.springframework.cloud</groupId> |
7 | <artifactId>spring-cloud-starter-netflix-hystrix-dashboard</artifactId> |
8 | </dependency> |
9 | <dependency> |
10 | <groupId>org.springframework.boot</groupId> |
11 | <artifactId>spring-boot-starter-actuator</artifactId> |
12 | </dependency> |
- 在application.yml进行配置:
1 | server: |
2 | port: 8501 |
3 | spring: |
4 | application: |
5 | name: hystrix-dashboard |
6 | eureka: |
7 | client: |
8 | register-with-eureka: true |
9 | fetch-registry: true |
10 | service-url: |
11 | defaultZone: http://localhost:8001/eureka/ |
- 在启动类上添加 @EnableHystrixDashboard来启用监控功能:
1 | |
2 | |
3 | |
4 | public class HystrixDashboardApplication { |
5 | |
6 | public static void main(String[] args) { |
7 | SpringApplication.run(HystrixDashboardApplication.class, args); |
8 | } |
9 | |
10 | } |
启动相关服务
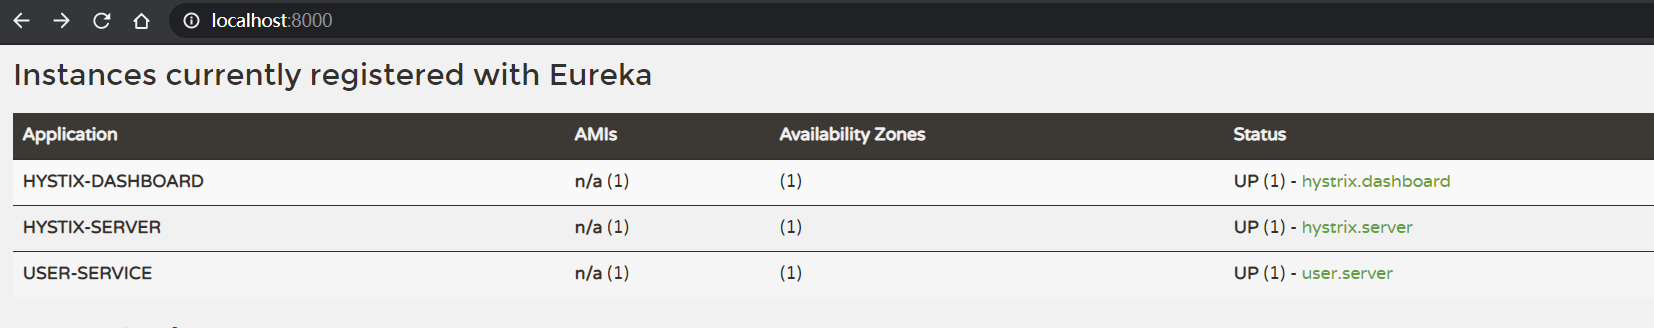
- 这次我们需要启动如下服务:eureka-server、user-service、hystrix-service、hystrix-dashboard,启动后注册中心显示如下。
Hystrix实例监控演示
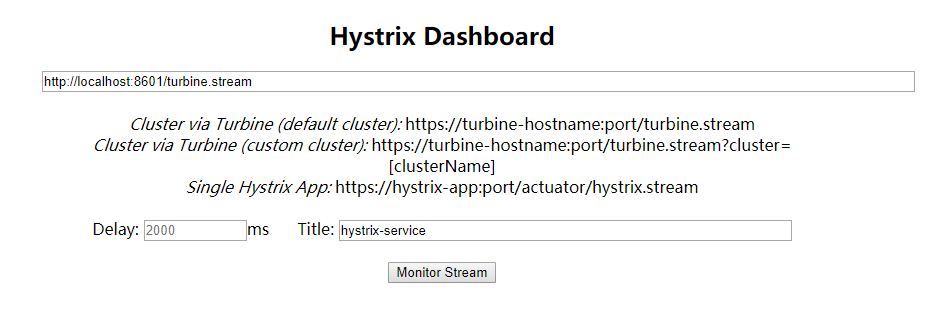
- 访问Hystrix Dashboard:http://localhost:8501/hystrix
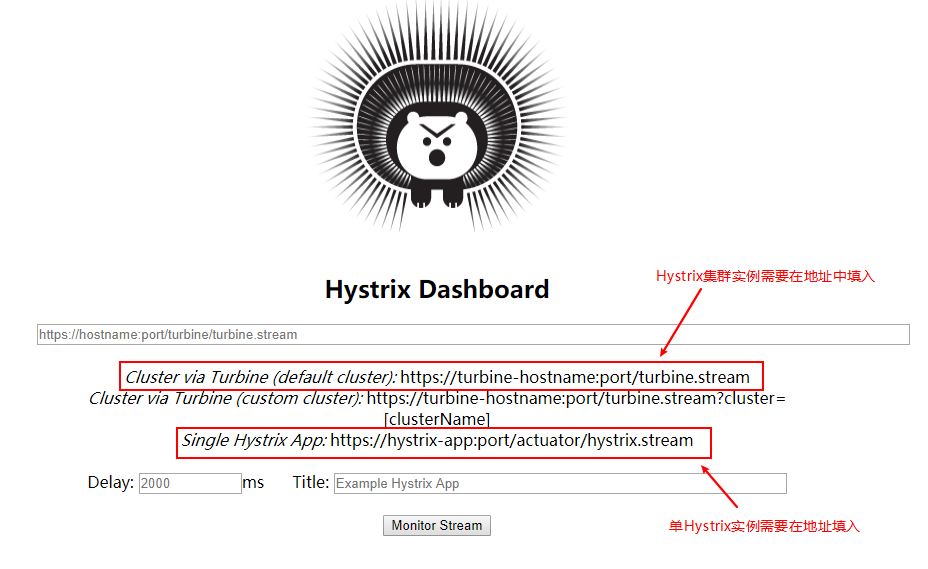
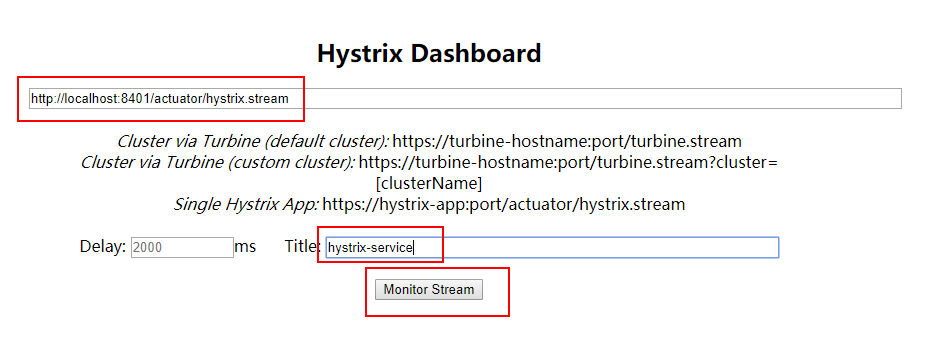
填写好信息后点击监控按钮,这里我们需要注意的是,由于我们本地不支持https,所以我们的地址需要填入的是http,否则会无法获取监控信息;
1http://localhost:8401/actuator/hystrix.stream2hystrix-service
- 还有一点值得注意的是,被监控的hystrix-service服务需要开启Actuator的hystrix.stream端点,配置信息如下:
1 | management: |
2 | endpoints: |
3 | web: |
4 | exposure: |
5 | include: 'hystrix.stream' #暴露hystrix监控端点 |
- 调用几次hystrix-service的接口:http://localhost:8401/user/testCommand/1
异常问题
异常1:
现象:
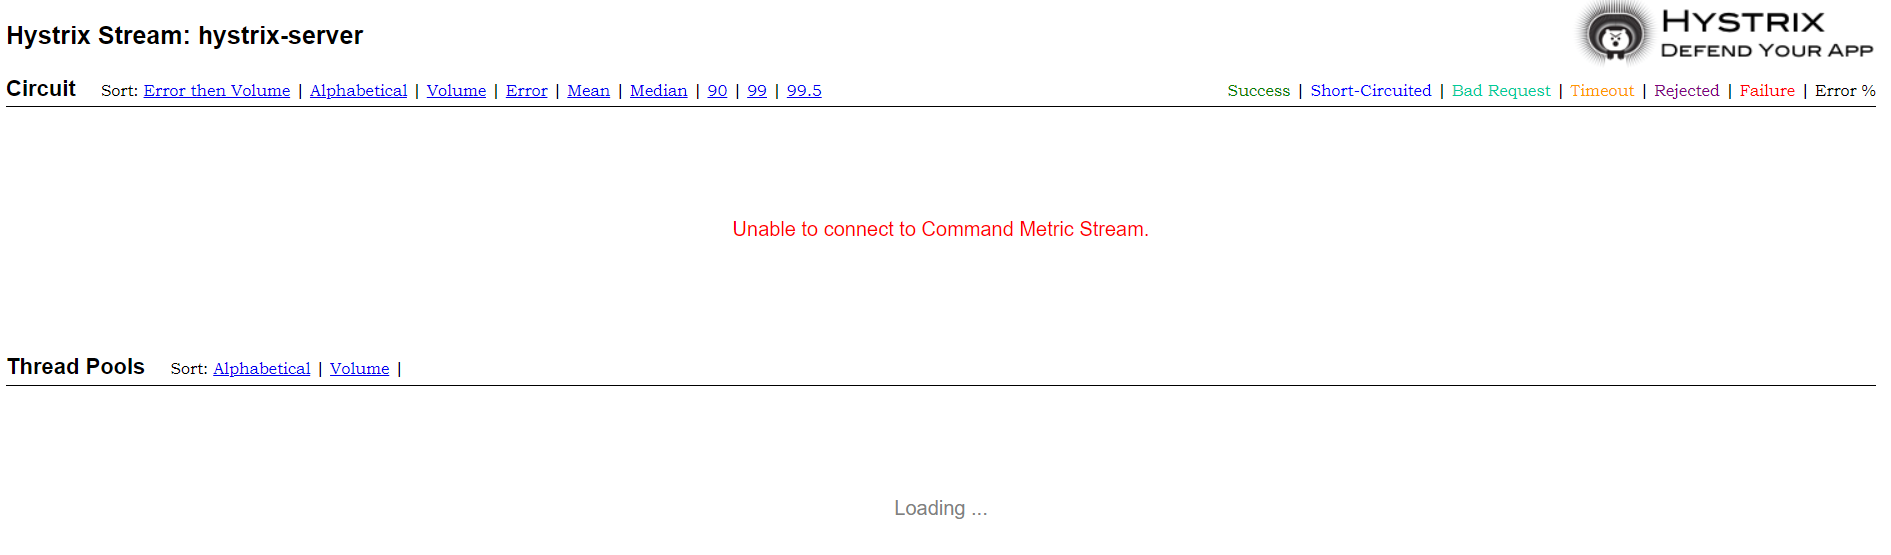
后台日志:Origin parameter: http://localhost:8401/actuator/hystrix.stream is not in the allowed list of proxy host names. If it should be allowed add it to hystrix.dashboard.proxyStreamAllowList.
问题解决方案:
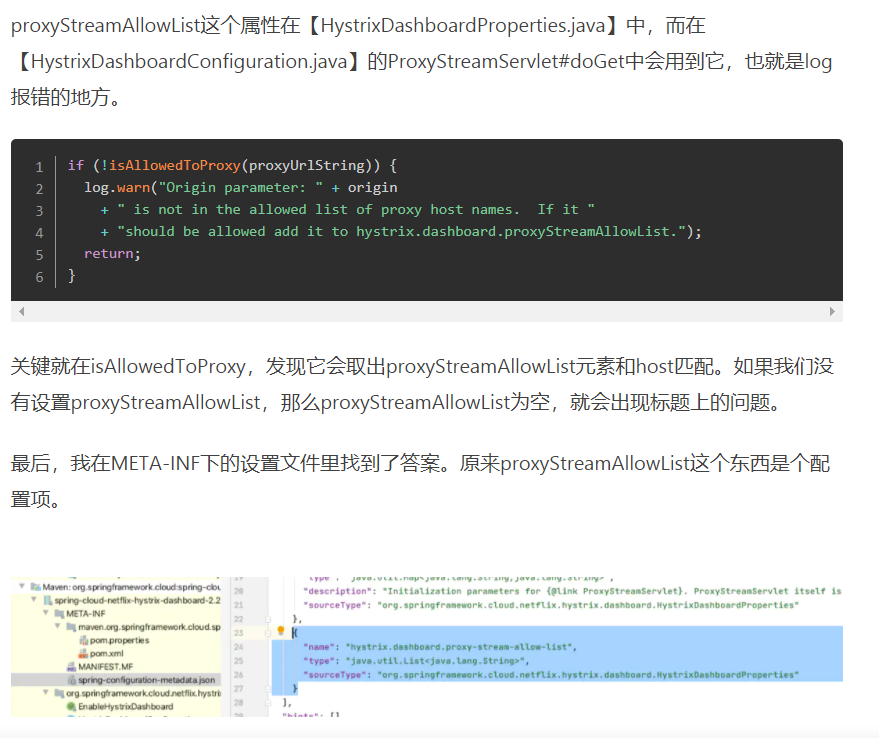
接下来就很简单了,HystrixDashboard工程加入配置。
1 | hystrix: |
2 | dashboard: |
3 | proxy-stream-allow-list: "localhost" |
参考:
https://www.jianshu.com/p/0a682e4781b0
异常2:
1 | ProxyStreamServlet : Failed opening connection to http://localhost:8401/actuator/hystrix.stream : 404 : HTTP/1.1 404 |
解决方案:
1 | |
2 | public class CommonConfig { |
3 | //解决问题:使用hystrix dashboard仪表盘时,Failed opening connection to http://localhost:8091/hystrix.stream?delay=100 : 404 : HTTP/1.1 404 |
4 | |
5 | public ServletRegistrationBean getServlet() { |
6 | HystrixMetricsStreamServlet streamServlet = new HystrixMetricsStreamServlet(); |
7 | ServletRegistrationBean registrationBean = new ServletRegistrationBean(streamServlet); |
8 | registrationBean.setLoadOnStartup(1); |
9 | registrationBean.addUrlMappings("/hystrix.stream"); |
10 | registrationBean.setName("HystrixMetricsStreamServlet"); |
11 | return registrationBean; |
12 | } |
13 | } |
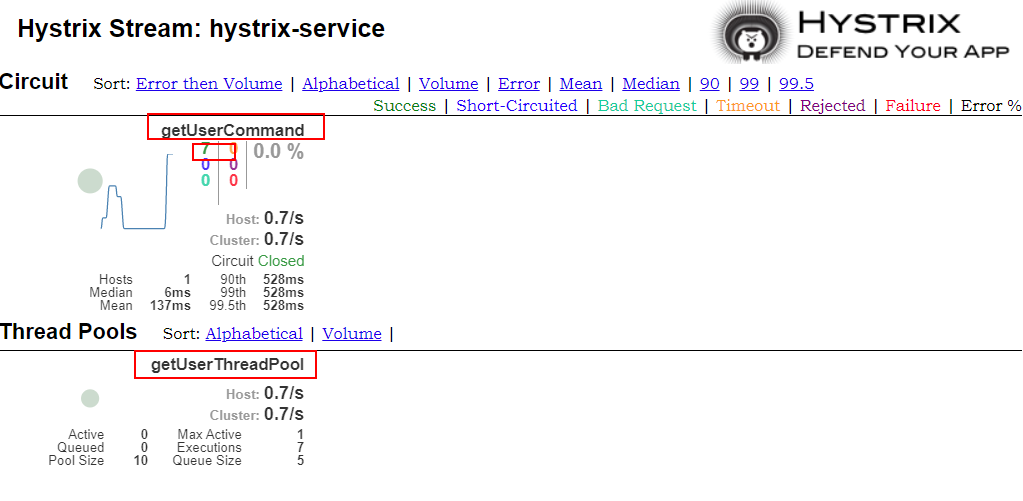
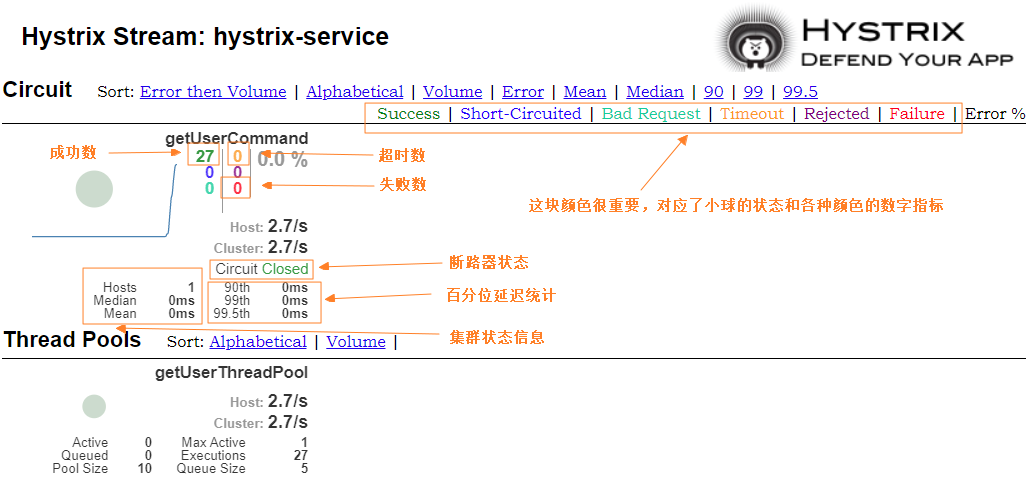
Hystrix Dashboard 图表解读
图表解读如下,需要注意的是,小球代表该实例健康状态及流量情况,颜色越显眼,表示实例越不健康,小球越大,表示实例流量越大。曲线表示Hystrix实例的实时流量变化。
使用到的模块
1 | ZBCN-SERVER |
2 | ├── zbcn-register/eureka-server -- eureka注册中心 |
3 | ├── zbcn-business/user-service -- 提供User对象CRUD接口的服务 |
4 | └── zbcn-common/ hystrix-server -- hystrix-server服务调用测试服务 |
5 | └── zbcn-common/ hystrix-dashboard -- 展示hystrix实例监控信息的仪表盘 |
Hystrix 集群实例监控
这里我们使用Turbine来聚合hystrix-service服务的监控信息,然后我们的hystrix-dashboard服务就可以从Turbine获取聚合好的监控信息展示给我们了。
创建一个turbine-service模块
用来聚合hystrix-service的监控信息。
- 在pom 中添加相关依赖
1 | <dependency> |
2 | <groupId>org.springframework.cloud</groupId> |
3 | <artifactId>spring-cloud-starter-netflix-eureka-client</artifactId> |
4 | </dependency> |
5 | <dependency> |
6 | <groupId>org.springframework.cloud</groupId> |
7 | <artifactId>spring-cloud-starter-netflix-turbine</artifactId> |
8 | </dependency> |
9 | <dependency> |
10 | <groupId>org.springframework.boot</groupId> |
11 | <artifactId>spring-boot-starter-actuator</artifactId> |
12 | </dependency> |
- 在application.yml进行配置,主要是添加了Turbine相关配置:
1 | server: |
2 | port: 8601 |
3 | spring: |
4 | application: |
5 | name: turbine-service |
6 | eureka: |
7 | client: |
8 | register-with-eureka: true |
9 | fetch-registry: true |
10 | service-url: |
11 | defaultZone: http://localhost:8001/eureka/ |
12 | turbine: |
13 | app-config: hystrix-service #指定需要收集信息的服务名称 |
14 | cluster-name-expression: new String('default') #指定服务所属集群 |
15 | combine-host-port: true #以主机名和端口号来区分服务 |
- 在启动类上添加@EnableTurbine来启用Turbine相关功能:
1 | |
2 | |
3 | |
4 | public class TurbineServiceApplication { |
5 | |
6 | public static void main(String[] args) { |
7 | SpringApplication.run(TurbineServiceApplication.class, args); |
8 | } |
9 | |
10 | } |
启动相关服务
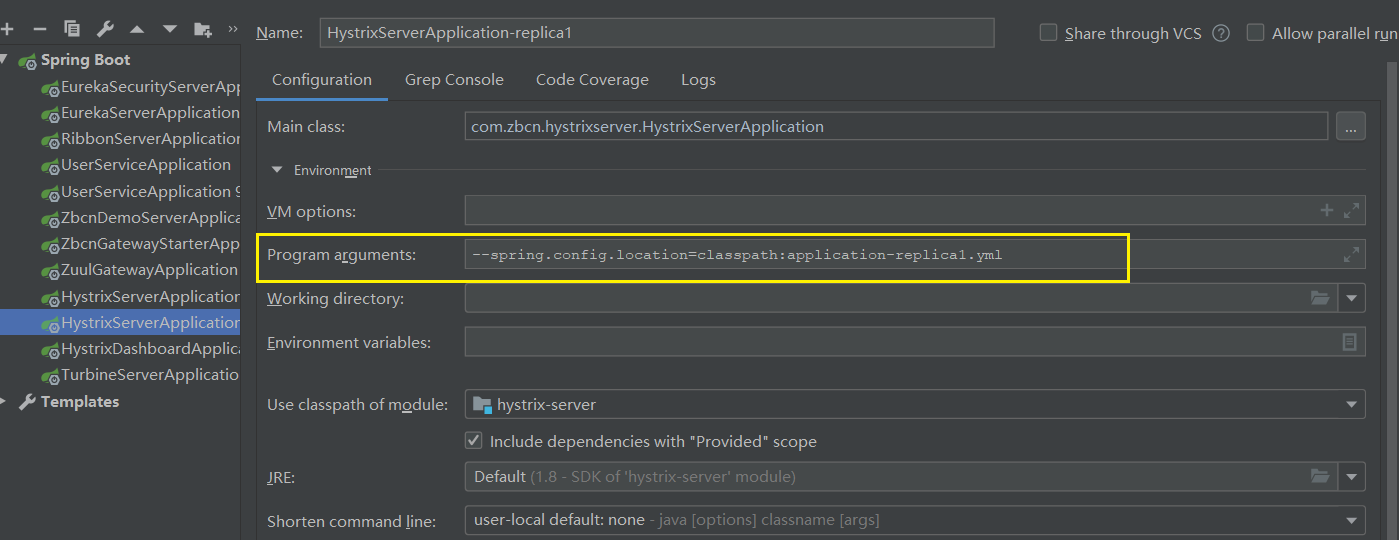
使用application-replica1.yml配置再启动一个hystrix-service服务,启动turbine-service服务,此时注册中心显示如下。
启动方式 是: 在program arguements栏添加: --spring.config.location=classpath:application-replica1.yml
参考:https://www.cnblogs.com/lyp-make/p/13353321.html
Hystrix集群监控演示
- 访问Hystrix Dashboard:http://localhost:8501/hystrix
- 添加集群监控地址,需要注意的是我们需要添加的是turbine-service的监控端点地址:
1 | http://localhost:8401/actuator/turbine.stream |
2 | turbine-service |
- 调用几次hystrix-service的接口:http://localhost:8401/user/testCommand/1以及http://localhost:8402/user/testCommand/1
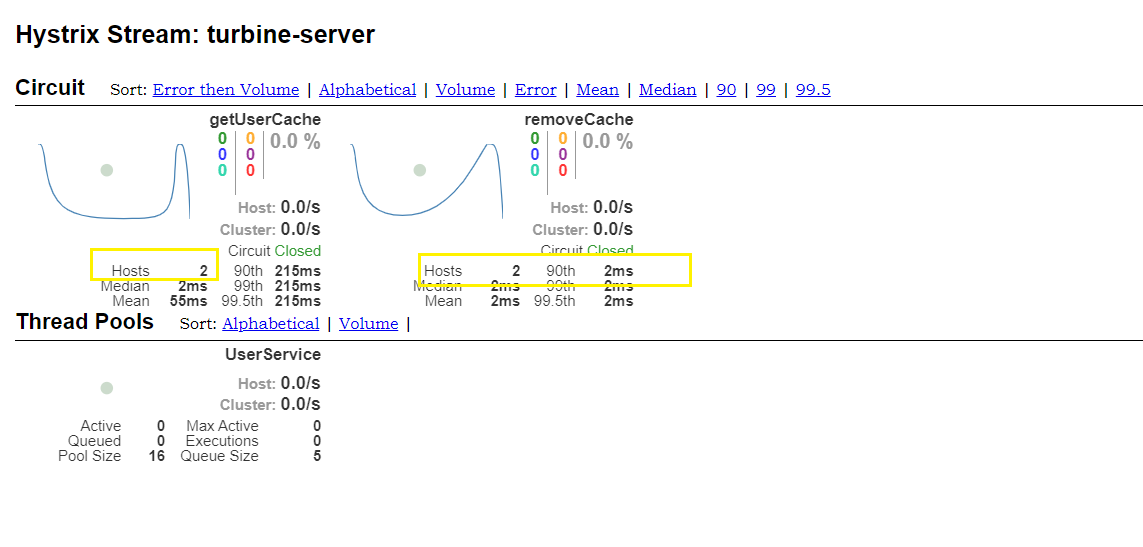
- 可以看到我们的Hystrix实例数量变成了两个。
使用到的模块
1 | ZBCN-SERVER |
2 | ├── zbcn-register/eureka-server -- eureka注册中心 |
3 | ├── zbcn-business/user-service -- 提供User对象CRUD接口的服务 |
4 | └── zbcn-common/ hystrix-server -- hystrix-server服务调用测试服务 |
5 | └── zbcn-common/ hystrix-dashboard -- 展示hystrix实例监控信息的仪表盘 |
6 | └── zbcn-common/ turbine-service -- 聚合收集hystrix实例监控信息的服务 |